Overview
Estimating the cost of constructing pipelines, especially in the oil and gas sector, involves various factors that significantly affect the overall expense. Here are some average costs from different sources:
- Oil & Gas Journal (2015-2016): $4.75 million/km for US onshore gas pipelines
- Oil & Gas Journal (2014-2015): $3.23 million/km for US onshore gas pipelines
- American Petroleum Institute (2017): $3.32 million/km as a national average for US onshore gas pipelines
- Global Fossil Infrastructure Tracker: $2.34 million/km across 64 global onshore and offshore projects
Cost Components
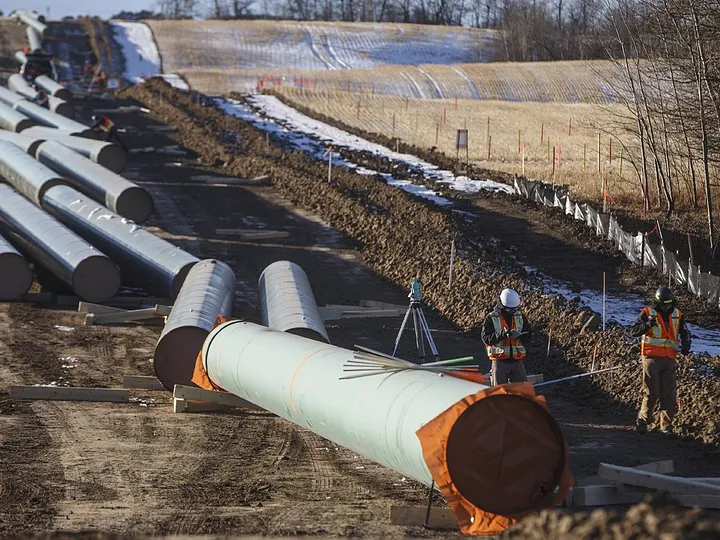
Pipeline construction costs are generally categorized into four main components: materials, labor, miscellaneous expenses, and right-of-way (ROW). These costs can vary based on location and time.
- Materials: This includes items like line pipes, pipe coatings, and cathodic protection systems.
- Miscellaneous: Covers a wide range of items such as surveying, engineering, supervision, contingencies, telecommunications equipment, freight, taxes, administration, overheads, and regulatory filing fees.
- Right-of-Way (ROW): Involves acquiring the necessary rights-of-way and compensation for damages.
Current Trends
The cost of building pipelines has seen significant increases in recent years. For example:
- In 2015-16, the average cost for proposed US onshore gas pipelines was $7.65 million/mile ($4.75 million/km), up from $5.2 million/mile ($3.23 million/km) in 2014-15.
- In previous years, the costs were lower, averaging $4.1 million/mile ($2.55 million/km) in 2012-13 and $3.1 million/mile ($1.93 million/km) in 2011-12.
Breakdown of Costs
In 2015-16, labor emerged as the most significant expense in pipeline construction, accounting for 47.08% of the costs, a rise from 37.77% in 2015. Materials accounted for 12.98%, down from 19.34% the previous year.
Regional Variations
The cost per mile for offshore pipelines is nearly double that of onshore pipelines, with a historical cost ratio of 1.96 in 2000-2001. In regions like the US Northeast, pipeline costs ranged from $5.5 million to $13.14 million per mile between 2017 and 2020.
Gazprom Costs
An analysis of Gazprom’s offshore construction costs revealed:
Nord Stream: €3.4 million/km
South Stream: €2.7 million/km
Dzhubga-Sochi: >€5.0 million/km
BTU Analytics Survey of U.S. Northeast and Central U.S. Pipelines
A BTU Analytics survey of nine gas pipelines in the U.S. Northeast found costs ranging from $5.5 million to $13.14 million per mile, with a median of $8.45 million/mile ($5.25 million/km). The pipelines were built from 2017 to 2020. Additionally, pipelines in the Great Plains and West Texas/Gulf Coast regions were analyzed, showing costs of $2.98 million/mile (2009 dollars) and $3.51 million to $5.15 million per mile in 2019.
American Petroleum Institute 2017 Estimate
The API estimated average U.S. pipeline costs at $178,000 per inch-mile for large gas transmission pipelines in 2016, translating to $5.34 million per mile or $3.32 million per km for a 30-inch pipeline. API also provided regional cost multipliers:
Central — 0.65
Midwest — 1.20
Northeast — 1.68
Offshore — 1.00
Southeast — 0.80
Southwest — 0.74
Western — 0.94
Estimating Construction Costs
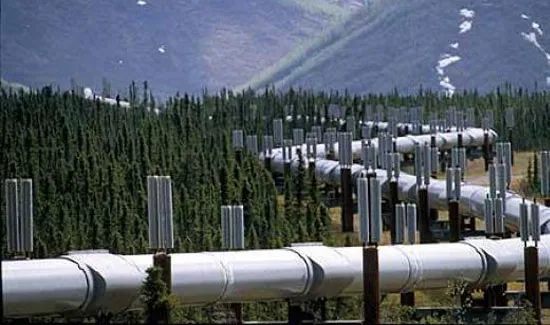
Pipeline construction costs can vary widely based on length and geographic area. Generally, longer pipelines tend to be more cost-efficient per mile. Costs are higher in populated areas and regions with challenging terrain like roads, highways, rivers, channels, marshes, or rocks.
A 2011 study in the Journal of Oil, Gas, and Coal Technology highlighted cost variability. It found that material costs increased with pipeline diameter and length but labor costs remained the highest component, averaging 40% of total costs. ROW costs were consistently 7% regardless of pipeline length. Regional differences showed material costs ranging from 24% in the Northeast and Southeast to 41% in the Central region, while labor costs varied from 34% to 48%.
Estimating Construction Costs
The cost of constructing pipelines varies widely based on length and geographic area. Generally, longer pipelines are more cost-efficient per mile. Costs increase in densely populated areas and regions with challenging terrain, such as roads, highways, rivers, and rocky areas.
Stranded Assets
Stranded assets refer to fossil fuel reserves that may become economically unviable due to shifts in regulations, market demand, or climate policies. A 2015 Nature study suggested that to meet global temperature targets, significant portions of fossil fuel reserves must remain unexploited. The potential financial impact of stranded assets could lead to global wealth losses of $1-4 trillion.
In summary, building pipelines is a complex and costly endeavor, influenced by numerous factors including material and labor costs, terrain challenges, and regional differences. The industry also faces future financial risks associated with stranded assets due to evolving environmental policies and market dynamics.

Yaropolk Dabrowski is a distinguished energy investing editor and a prominent expert in financial topics, renowned for his keen insights and analytical approach to the complex intersections of energy markets and investment strategies. With over a decade of experience in the financial sector, Yaropolk has established himself as a thought leader, guiding investors through the intricacies of sustainable energy investments and the impact of global market trends. His expertise spans across diverse areas, including renewable energy, oil and gas, and emerging technologies, enabling him to provide nuanced perspectives that resonate within the financial community.
Recognized for his contributions to top-tier publications, including Forbes, Yaropolk’s writing blends rigorous research with accessible language, making him a sought-after commentator on financial developments. His collaborative efforts with leading investment firms and industry experts further cement his reputation as a trusted resource for investors looking to navigate the dynamic landscape of energy investment. Beyond his editorial work, Yaropolk is dedicated to educating the next generation of investors, advocating for responsible and sustainable investing practices that prioritize long-term growth and environmental stewardship.